%20(3).png)
25 SaaS OKRs for ARR Growth, Retention, Product Adoption, and Efficiency

Updated: Sep 30
SaaS OKR: Your biggest threat to your SaaS business isn't your competitors; it’s a weak strategy dressed up in strong headline numbers. You probably celebrate every ARR milestone, but that single number can hide real problems underneath the surface.
Investors are more interested in efficient, sustainable growth than in spending. This implies that your SaaS OKRs should go beyond mere growth chasing. They should focus on healthy, recurring growth instead. This guide gives you 25 focused OKRs to help align your whole team around a lasting revenue engine.

▍ 25 SAAS OKR EXAMPLES AT A GLANCE
Category | The five OKRs | Headline metric |
ARR and pipeline | Qualified pipeline, new ARR, enterprise growth, partner revenue, sales efficiency | New ARR |
Activation and adoption | Time-to-value, activation, core-feature adoption, multi-user adoption, product-qualified leads | Activation rate |
Retention | Gross revenue retention, logo churn, risk identification, renewal predictability, customer health | GRR |
Expansion | Net revenue retention, seat expansion, product expansion, usage growth, expansion pipeline | NRR |
Efficiency | Gross margin, CAC payback, burn multiple, support efficiency, reliability and cloud cost | Burn multiple |
How SaaS OKRs Connect the Recurring-Revenue Engine
Imagine your SaaS company is a pipeline that has 6 stages. Each one receives every dollar of recurring revenue. Your SaaS OKRs need to track what's happening at every single point.
Acquisition
This is where leads come into your pipeline. You spend money on marketing and sales to fill it up. But bringing in leads without checking their quality is just spending money for nothing. If you sign up customers who do not fit, they will eventually leave. Then, when they depart, your recurring income suffers.
Activation
The customer has signed the contract. Now they have to see the value in your product. Activation happens the moment your product gives them their first real win. That may be their first board for a project management tool. For an analytics platform, it could be their first data source connection. Without activation, adoption will not take off.
Adoption
This is for regular, continued use. Are customers using the features that actually keep them around? Do they log on each week? Adoption isn't about counting total users or other feel-good numbers. It's a question of whether the customer has integrated your product into their actual work.
Retention
This is about holding onto what you've already got. Gross revenue retention (GRR) indicates whether existing customers continue to spend at the same rate. It's your foundation. For most B2B SaaS businesses, a good level of GRR is above 90 percent. If it's not, you're losing money at a rate that exceeds your new customer acquisition.
Expansion
Here's where things get interesting. If your NRR is above 100 percent, it means that your existing customers are spending more over time. They're buying more of your product, adding seats, or using your product more. With expansion, your existing customers become your growth engine.
Efficiency
This is what all of the above costs you. CAC payback tells you how many months it takes to earn back what you spent acquiring a customer. Gross margin is a reflection of the amount of revenue you retain after providing your service. Efficiency is where you'll find out whether you're growing or just spending money to make ends meet.
The limitations of ARR
In SaaS OKRs, ARR only displays your current revenues. It will not tell you if that revenue is guaranteed, if it's possible to increase it, or if you're spending too much to produce it. The six stages listed above provide you with the big picture. All of these should be addressed in your SaaS OKRs.

SaaS OKR Examples for ARR and Pipeline Growth
These SaaS OKR examples are the fuel for your engine. Without a healthy pipeline, nothing else matters. But it is not about volume; it is about quality and conversion velocity.
Qualified pipeline
Objective: Develop a repeatable and effective sales funnel that generates revenue.
Key Results:
Generate 150 sales-qualified leads (SQLs) monthly – these are accounts that have a budget, a decision maker, and a clear pain point that aligns with our solution.
Raise the average size of qualified deals from $25,000 to $35,000 by focusing on enterprise accounts that have higher budgets.
Develop a clear lead-nurturing sequence to reduce the average number of days a lead spends in the "qualified" stage from 45 to 30 days.
Close qualified opportunities with a 35% win rate this quarter.
New ARR
Objective: Create new business revenue from net-new customers.
Key Results:
Close $5M in new Annual Recurring Revenue (ARR) this quarter from new logos only.
Maintain an average discount rate below 12% on all new deals to preserve our long-term revenue integrity.
Reduce the average sales cycle for new-logo deals from 90 to 75 days by streamlining the procurement and security review process.
Raise the percentage of New Deals closed by Trial-to-Paid Motion from 15% to 25%.
Enterprise segment growth
Objective: To target the enterprise market through the deployment of an enterprise sales model targeting large accounts
Key Results:
This quarter, boost new ARR from enterprise accounts (companies with 1,000+ employees) by 40%.
Establish 5 new pilot programs in the enterprise with the potential for full deployment.
Grow the average contract value (ACV) for enterprise deals from $75,000 to $100,000 by bundling premium support and advanced security features.
Ensure 80% of enterprise champions participate in our quarterly business review (QBR) process.
Partner revenue
Objective: Use strategic partners to speed up pipeline growth and deal closing.
Key Results:
Get 25% of this quarter's new ARR from partner referrals and co-selling.
Bring on 10 strategic partners already serving our target ICP with customers in our vertical.
Grow partner-sourced average deal size by 15% versus non-partner deals.
Cut the sales cycle for partner deals by 20% using partner-led demos and technical validation.
Sales efficiency
Objective: Maximize cost of customer acquisition to create a scalable and profitable go-to-market engine.
Key Results:
Increase sales efficiency ratio (new ARR / total sales and marketing spend) from 0.8x to 1.2x.
Reduce the Customer Acquisition Cost (CAC) from $40,000 to $30,000 by improving lead qualification and conversion.
Improve marketing-to-sales qualified lead (MQL to SQL) conversion rate from 20% to 30%
Reduce non-selling activities (e.g., internal meetings, reporting, etc.) in the sales cycle from 30% to 20%

SaaS OKR Examples for Activation and Product Adoption
Acquisition gets someone through the door. Activation is what convinces them to stay it's the moment you actually prove your product's worth. If a new user doesn't have that "aha" moment in their first session, there's a high likelihood that they will not return at all.
Time-to-value
Objective: Cut down how long it takes a new user to reach the core value of our product.
Key Results:
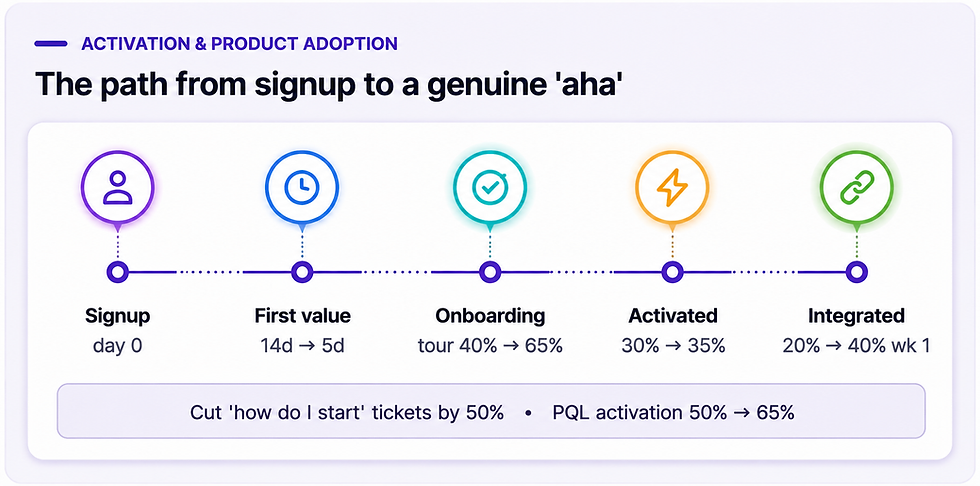
Shrink the gap between signup and that first "aha" moment say, building their first project or report from 14 days down to 5.
Increase completion rate for guided onboarding tour from 40% to 65%.
Reduce by 50% the number of "how do I get started" tickets.
Increase the percentage of trial users who integrate our product with tools they already use, such as Slack or Salesforce, from 20% to 40% in their first week.
Activation
Objective: Improve the activation rate of new users to become value-realizing users.
Key Results:
Increase the overall user activation rate from 30% to 35% (defined as users who complete the key milestone).
Boost activation rate of users from a product-qualified lead (PQL) funnel from 50% to 65%.
Lower the activation drop-off rate at the 'invite team members' step from 60% to 45%.
Raise the number of users who return for another week after their first activation from 80% to 90%.
Core-feature adoption
Objective: Deepen engagement with the features that make our product uniquely valuable.
Key Results:
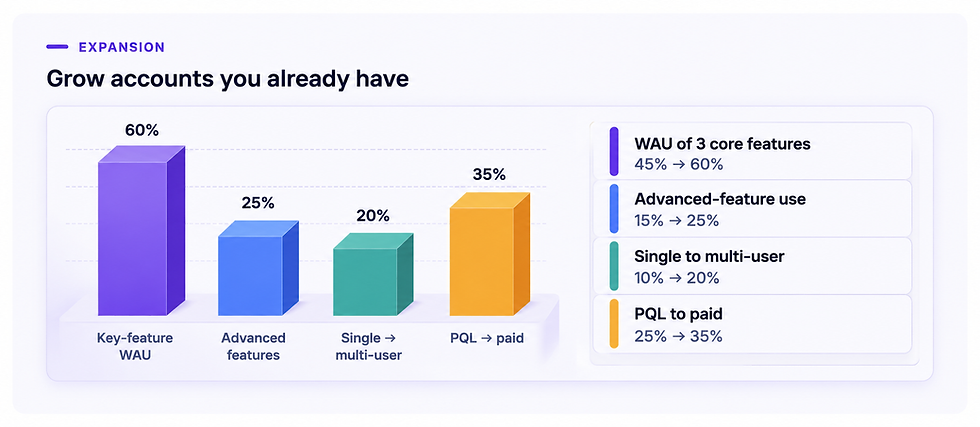
Drive weekly active use of our three key features (reporting, automation, and collaboration) from 45% to 60% of all active users.
Raise the average number of core feature actions per user per week from 10 to 15.
Raise the percentage of users who use the product's "advanced" features from 15% to 25%.
Get 30% adoption of our latest core feature within 60 days of launch.
Multi-user adoption
Objective: To boost product adoption among current customers to drive stickiness and lower churn.
Key Results:
Increase average users per paying account from 4 to 6.
Increase the number of users per account from 5 to 10.
Increase the average number of teams in an enterprise account to 3 from 2.
Increase single-user trial plan to paid multi-user plans from 10% to 20%.
Product-qualified leads
Objective: Create high-intent sales opportunities directly from product usage data.
Key Results:
Generate 75 to 100 more Product-Qualified Leads (PQLs) each month.
Increase the conversion rate of PQLs to paid customers from 25% to 35%.
Reduce the average time taken to get a PQL to a paid deal from 30 days to 21 days.
Improve the average deal size of PQL-sourced deals by 20% over other lead sources.

SaaS OKR Examples for Retention and Customer Health
Retention is what keeps a SaaS business standing. Let churn run wild, and you're on a slow spiral toward zero. The real work isn't taking action when someone cancels; it's taking action before they walk away.
Gross revenue retention
Objective: Hold onto the revenue you already have by cutting down on downgrades and cancellations.
Key Results:
Maintain Gross Revenue Retention (GRR) at or above 90% for this quarter.
Cut revenue lost to downgrades (excluding cancellations) from 5% down to 3%.
Push renewals at the same or higher price point from 85% up to 90%.
Trim average renewal discounts from 10% to 5% by proving real ROI.
Logo churn
Objective: Reduce the number of customers leaving our product to an industry-leading minimum.
Key Results:
Minimize logo churn from 8% to 5% per year.
Reduce churn for customers with more than 12 months of activity from 4% to 2%.
Implement an "at-risk" customer playbook and reduce churn among that segment by 25%.
Perform exit interviews with 100% of customers who churn and determine the top two reasons why customers are leaving.
Risk identification
Objective: Proactively identify and intervene with customers showing signs of disengagement.
Key Results:
Flag 75% of "at-risk" customers (based on a health score below 40) at least 30 days before their renewal date.
Increase the Customer Health Score average from 65 to 80.
Reduce the number of customers with a "Critical" health score (below 30) from 15 to 8.
Achieve a 40% "win-back" rate on at-risk accounts targeted with a proactive outreach campaign.
Renewal predictability
Objective: Gain 100% visibility into the renewal pipeline to forecast revenue accurately.
Key Results:
Increase the percentage of renewals with a forecasted status from 60% to 90% 60 days in advance.
Maintain a 95% forecast accuracy rate for renewals in the current quarter.
Decrease the number of "slipped" renewals (renewals pushed to the next quarter) from 10 to 3.
Make sure that 100% of enterprise renewals undergo a formal business review 45 days before the renewal.
Customer-health improvement
Objective: Systematically improve the overall health of our customer base to drive long-term loyalty.
Key Results:
Improve average NPS score from 45 to 55.
Increase the percentage of customers in the "Healthy" health score band (above 70) from 50% to 65%.
Reduce support ticket volume per active user from 0.8 to 0.5 by improving the knowledge base and self-service options.
Maintain a positive sentiment score of 90% in support interactions.


SaaS OKR Examples for Expansion
Net revenue retention
Objective: Maximize revenue from existing customers by expanding their business with us.
Key Results:
Achieve a Net Revenue Retention (NRR) of 120% (existing customers spend 20% more).
Increase expansion revenue (upsells + cross-sells) by 40% over the previous quarter.
Achieve an average expansion deal size of $20,000.
Increase percentage of customers who expand within 6 months from 15% to 30%.
Seat expansion
Objective: Grow the number of paid users per existing account.
Key Results:
Increase seat expansion rate to 30% (percent of accounts that added seats).
Achieve an average seat increase of 5 seats for each account that expands their number of seats.
Increase the upselling success rate for 10-50 seat expansions from 40% to 60%.
Reduce sales cycle for seat expansion (from 30 to 14 days).
Product expansion
Objective: Increase the adoption of new products and modules by existing customers.
Key Results:
Achieve a 20% attach rate on new product modules (e.g., Analytics or API add-ons).
Drive 50 customers to adopt a new feature or module within 30 days of launch.
Increase the average number of products per customer from 1.5 to 2.0.
Achieve 25% of expansion revenue from cross-selling new product lines.
Usage growth
Objective: Drive customers to use the product more, unlocking higher pricing tiers.
Key Results:
Increase usage expansion for 15% of customers (moving them to the next pricing tier).
Achieve a 25% increase in API consumption across the customer base.
Increase the average storage usage per account by 30%.
Achieve a 15% increase in monthly active users (MAU) per account.
Expansion-pipeline conversion
Objective: Create a predictable pipeline of expansion opportunities that can be turned into revenue.
Key Results:
Convert 25% of the expansion pipeline to closed-won deals this quarter.
Generate 75 expansion opportunities through the Customer Success team's proactive outreach.
Increase our average expansion deal size from $15,000 to $20,000.
Reduce the average sales cycle of expansion deals from 45 to 30 days.
SaaS OKR Examples for Efficiency and Platform Health
In SaaS OKRs, scale is dangerous if it is not efficient. You must be able to demonstrate that your business model is viable. This is what investors look at.
Gross margin
Objective: Make our core software delivery more profitable.
Key Results:
Keep Gross Margin at or above 80%.
Lower per active user infrastructure cost from $1.20 to $1.00.
Reduce the cost of third-party services and APIs by 15%.
Reduce average cost per ticket from $15 to $12, improving support cost efficiency.
CAC payback
Objective: Lower the cost of acquiring a new customer.
Key Results:
Reduce the CAC payback period from 18 months to 12 months.
Achieve this by improving sales efficiency and increasing the average deal size.
Cut marketing budgets by 20% on non-performing channels.
Raise new ARR from Organic sources (direct CAC = 0) from 15% to 25%.
Burn multiple
Objective: Maximize the cash productivity of our expansion.
Key Results:
Maintain a Burn Multiple (net burn / new ARR) below 1.5x.
Reduce non-sales and marketing operating expenses as a percentage of revenue from 40% to 35%.
Extend the cash runway from 12 months to 18 months.
Achieve positive cash flow from operations by Q4.
Support efficiency
Objective: Scale Customer Support Operations Without Proportionally Increasing Costs
Key Results:
Improve Support Efficiency Ratio (Customers/Support Agent) – From 5:1 to 6:1.
Increase Resolution Rate for support tickets with no agent involved (Self-Service) - From 30% to 45%.
Reduce Average First Response Time - From 4 Hours to 2 Hours.
Reduce the average time to resolve a support ticket from 24 hours to 16 hours.
Reliability and cloud cost
Objective: Ensure platform reliability and cost-efficiency as we scale.
Key Results:
Achieve 99.99% uptime for the platform.
Reduce cloud infrastructure costs per active user by 15% due to resource optimization.
Reduce the number of P1 (critical) incidents by 25%.
Implement auto-scaling policies to reduce cloud costs during off-peak hours by 15%.
How to Choose SaaS OKRs by Company Stage
Your SaaS OKRs should match where your company actually is, not where you want it to be.
Pre-PMF (Product-market fit)
Making money isn't the main goal for you at this point. Focus on your Weekly Active Users and Activation Rate to determine if your users like what you've built. Don't get distracted chasing revenue. Even if you start making sales, you can be deeply unfit for your market.
Early Growth
Your business model has been validated; now it's time to scale that model. While your focus should be on MRR, keep an eye on Churn Rate, CAC, and LTV: CAC to make sure your growth is sustainable. Focus on converting your early successes into a repeatable process.
Scale-up
Growth is great, but you better be efficient while growing. The goal here is an NRR of over 110%, with Gross Margin north of 80% and a Burn Multiple below 2.0x. Begin segmenting your customers into SMB, Mid-Market, and Enterprise.
Enterprise Expansion
You are now trying to balance growth with long and complex contracts. Target specific industries, have longer sales cycles, and spend the most on retaining and expanding your biggest accounts.
Profitability Stage
To attract public investors, pursue the Rule of 40 (Growth Rate + Profit Margin ≥ 40%) and strong Free Cash Flow. Growth and profitability are given equal importance now. Selecting SaaS Key Results Based on Company Stage
▍ SAAS OKRS BY COMPANY STAGE
Stage | Focus | Key results to use |
Pre-PMF | Learning and activation | Weekly active users, activation rate |
Early growth | Scaling the model | MRR, churn rate, CAC, LTV:CAC |
Scale-up | Efficient growth | NRR over 110%, gross margin over 80%, burn multiple under 2.0x |
Enterprise expansion | Long, complex contracts | Industry segments, sales cycle, retention and expansion |
Profitability | Growth and profit equally | Rule of 40, free cash flow |

Common SaaS OKR Mistakes
ARR without quality guardrails
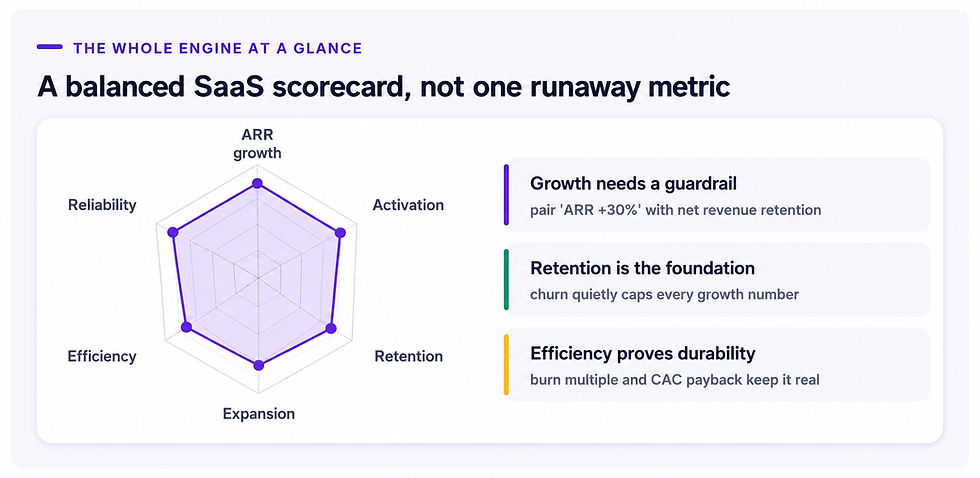
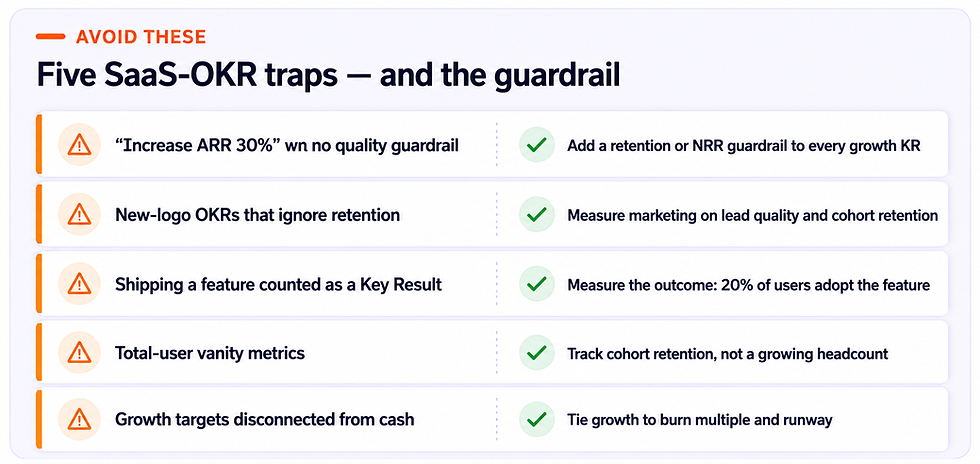
In SaaS OKRs, a KR to "Increase ARR by 30%" is dangerous. You need to add a guardrail: "Increase ARR by 30% with GRR > 90%." Don't sacrifice a healthy customer base for top-line growth.
New logos without retention
Don't create OKRs for marketing that are only about new signups. Marketing should be measured on the quality of the leads they generate, which is reflected in their retention rates.
Feature releases as KRs
A KR to "Ship a new feature" is an output, not an outcome. It should be "Drive 20% of users to adopt the new feature." If you ship it and no one uses it, you've failed.
Total-user metrics instead of cohorts
Don't measure total users. Instead, measure cohort retention. A cohort of users signed up in Q1 will tell you the true impact of your work.
Growth targets disconnected from cash
Growing 20% MoM with a 5x burn multiple is worse than growing 12% MoM with a 1.5x burn multiple. Focus on profitable growth, not just growth at any cost.
SaaS OKR FAQs
What are good SaaS OKRs?
Good SaaS OKRs are outcome-oriented, measurable, and directly linked to the key metrics of recurring revenue such as MRR/ARR, Churn, NRR, CAC, and LTV. They care more about the health of the revenue engine than they do its size.
Can ARR be a Key Result?
Yes, ARR can be a key result, but with one very important caveat. It should be accompanied by guardrails such as "Grow ARR to $15M while maintaining Gross Revenue Retention above 90%." ARR can be a dangerous vanity metric if not used with quality metrics.
Is NRR a KPI or OKR?
NRR is both. It is an important health indicator that should be continually tracked as a KPI. When you need to make a conscious and large improvement (e.g., "Improve NRR from 105% to 115%") it becomes a strategic goal as an OKR.
What OKRs should a SaaS CEO own?
The CEO holds the highest level of SaaS OKRs that span functions. This usually consists of one Revenue Growth objective, one Retention/Efficiency objective, and one critical Organizational Capability (e.g., new leadership team). They also take care of cross-company metrics such as ARR, NRR, Gross Margin, etc.
How do SaaS OKRs change by stage?
Before PMF, focus on learning and Activation. Test the model using MRR and Churn targets in Early Growth. In Scale-up, use efficiency measures, such as NRR and Burn Multiple. Lastly, apply the Rule of 40 to achieve a balance between growth and profit in Profitability.
What are the best SaaS OKR examples?
The best SaaS OKR examples pair a growth target with a guardrail, like new ARR with gross revenue retention above 90%, or NRR above 110% with a burn multiple under 2.0x. Pick three to five for the quarter, matched to your stage, and track them weekly in OKR software.


Comments